Manufacturing Maturity Assessment

From operational risk to world-class manufacturing capability.

ROOT CAUSE DIAGNOSIS

Manufacturing problems are rarely isolated problems.

Missed production targets, schedule instability, excess WIP, downtime, material shortages, labor inefficiency, scrap, rework, quality escapes, expediting, and capacity constraints can look like separate issues.

In practice, they often originate from deeper capability gaps.

“Correcting a symptom can restore output temporarily. Correcting the capability gap makes the improvement more repeatable.”

SYSTEM MAPPING

Symptom-to-Capability Gap Correlation

How operational friction traces back to core execution pillars

G1

Predictive & Preventive Reliability

Asset Performance

G2

Production Control & Dispatching

Order Execution

G3

Dynamic Line Replenishment Systems

Material Flow

G4

Rigorous Process & Standard

Operator Methods

G5

Integrated Quality Loop Gates

Escape Prevention

OPERATIONAL BLUEPRINT

Risk shows exposure. Maturity explains why.

01 / PROACTIVE EXPOSURE

OPERATIONAL RISK

Where is the operation vulnerable today? 

Identifies exposure, instability, and points of failure that threaten safety, delivery, quality, cost, and continuity of supply. 

02 / SYSTEMIC CAPABILITY

MANUFACTURING MATURITY

How capable is the manufacturing system? 

Determines whether the operation can consistently control that exposure and achieve required performance without heroic effort. 

DSI combines both perspectives. Risk establishes urgency. Maturity establishes cause, sequence, and the capability required to hold the gain. One assessment produces both.

STRATEGIC TRIGGERS

When an MMA makes sense.

Use the assessment when the operation is telling you something is wrong, but the right response is not obvious.

01

Production targets are frequently missed despite high overtime and constant expediting.

02

Schedule instability has become normal, with daily firefighting replacing scheduled execution.

03

WIP, scrap, rework, and unplanned downtime keep returning even after targeted corrective projects.

04

The true constraint of the plant is not clear, leading to competing capital investment opinions.

05

The organization is preparing for a major facility expansion, floor consolidation, or greenfield launch.

06

Evaluating automation, robotics, or MES readiness, needing to verify if current processes are mature enough.

07

Ownership or new leadership wants an independent, empirical second opinion on actual operational health.

08

The plant is undergoing key-person transitions and needs to capture standard operating systems.

A group of people in a meeting room, observing a presentation titled "Project Titan: Path Forward" on a screen. Plans and water bottles on the table.

OUR INTEGRITY

Get the outside perspective without the consulting theater.

We base our conclusions on objective plant-floor evidence: operational data, documents and standards, leadership and operator interviews, direct observation, and process and material flow analysis.

MMA is delivered by qualified DSI manufacturing practitioners applying structured judgment against defined criteria.

Every maturity level is traceable to what was observed, measured, or verified onsite. We assess what is actually happening, not simply what the process is intended to do.

THE STANDARD

The DSI Manufacturing Maturity Index

The MMI gives leadership a common language for describing how reliably the manufacturing system can perform today, from reactive firefighting to self-optimizing loops.

Level 1

Uncontrolled

REACT & RECOVER

Firefighting, tribal knowledge, individual dependency, unstable processes.

Level 2

Controlled

ESTABLISH CONTROL

Basic controls exist, but execution remains inconsistent and locally dependent.

Level 3

Standardized

CREATE REPEATABILITY

Processes, responsibilities, measures, reaction plans, and management routines are formally defined and consistently executed.

Target Baseline

Level 4

Integrated

CONNECT THE SYSTEM

People, processes, equipment, information, and functions operate as a coordinated manufacturing system.

Level 5

Optimized

CONTINUOUSLY ADVANCE

Learning, analytics, prediction, automation, and adaptive practices improve performance where they create measurable value.

Technology enables maturity. It does not substitute for manufacturing discipline.

ASSESSMENT SCOPE

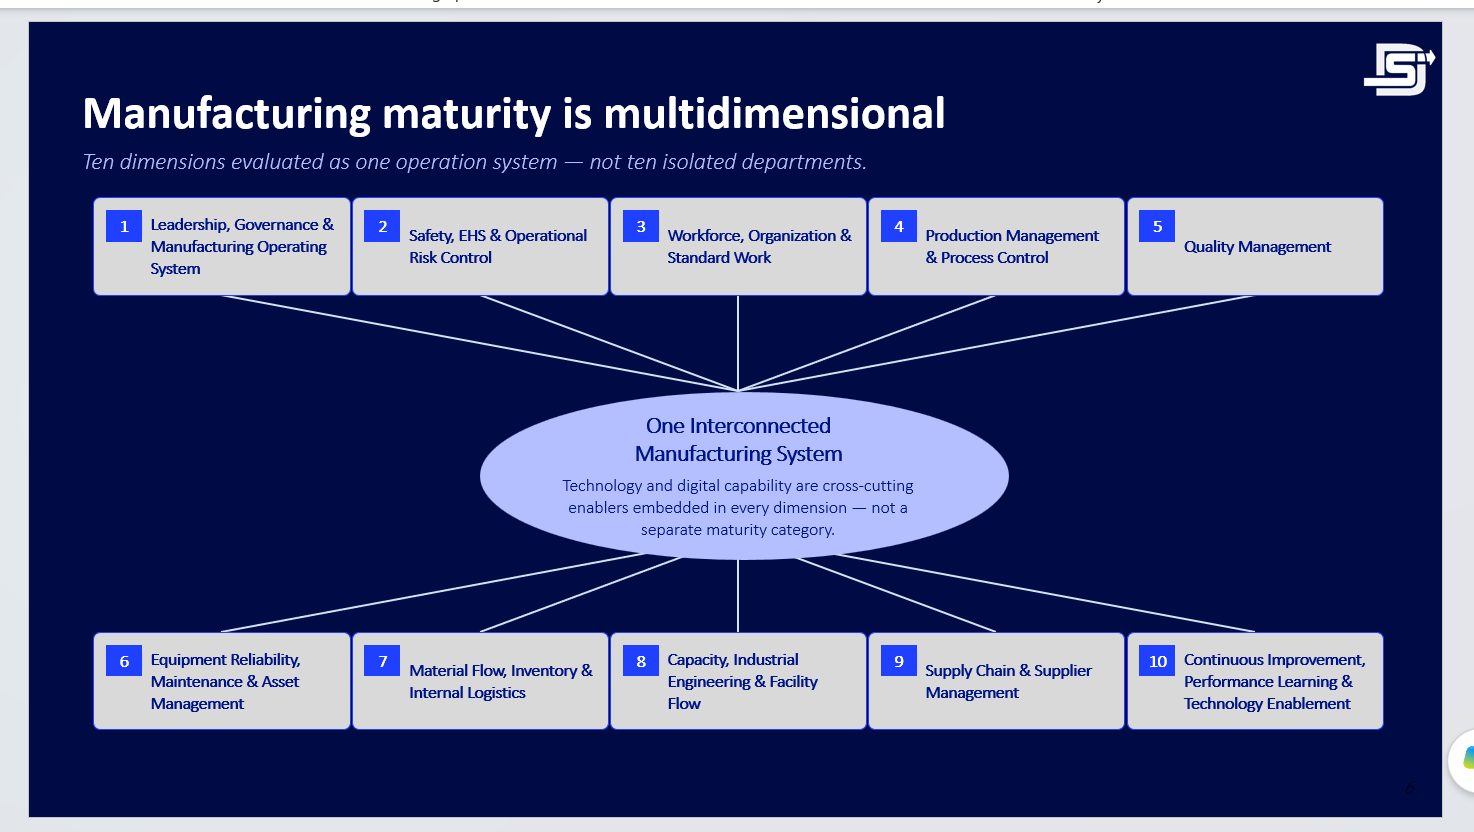
Ten dimensions. One system.

The MMA evaluates 10 executive dimensions as one operating system, not 10 isolated departments.

01

Leadership & Governance

Strategic deployment and operations metrics governance.

02

Safety & EHS Culture

Proactive hazard mitigation and shop floor ergonomic metrics.

03

Workforce & Standard Work

Instruction execution and dynamic cross-training matrices.

04

Production Management

Optimal dispatch, line scheduling, and real-time WIP control.

05

Quality Management

In-line error proofing, scrap control, and closed feedback gates.

06

Equipment Reliability

Preventative regimens and overall OEE performance health.

07

Material Flow & Logistics

In-plant tuggers, lineside pull, and warehouse logic.

08

Capacity & Industrial Engineering

Value stream mapping, line balancing, and cycle studies.

09

Supply Chain Alignment

Inbound reliability, dock logistics, and buffer integrity.

10

CI & Technology Enablement

Rigorous continuous improvement cycle and smart tools.

ASSESSMENT DEPTH

Executive Simplicity. Practitioner Depth

two-factory-workers-inspecting-green-pipes-facilities-supervision-design-systems-de-mexico (1)
01

Safety / EHS

  • Compliance Management

  • Hazard Identification & Risk Assessment

  • Ergonomics & Human Factors

  • Incident Learning

  • EHS Management

two-factory-managers-inspecting-blueprints-design-systems-de-mexico
02

Production Management

  • Planning & Scheduling

  • Dispatch & Execution

  • Process Definition & Control

  • WIP, Flow & Constraint Management

  • Visibility & Abnormality Response

male-electrical-engineer-inspecting-cables-white-hat-arc-flash-design-systems-canada
03

Quality

  • Quality Governance

  • Process Quality & Control Planning

  • Root Cause & Corrective Action

  • Traceability & Customer Protection

  • Supplier Quality

The executive sees the maturity profile. DSI practitioners establish the evidence behind it.

DSI OPERATIONAL ASSESSMENT FRAMEWORK

Assessment to an actionable roadmap.

01

ALIGN

Understand the business, operation, objectives, and concerns.

02

PREPARE

Review data, documents, scope, and practitioner workstreams.

03

ASSESS

Observe, interview, validate, analyze, and score.

04

DIAGNOSE

Identify root causes, risks, constraints, and systemic weaknesses.

05

BENCHMARK

Compare capability to the DSI World-Class Reference State.

06

CONCEPT

Identify credible manufacturing solution approaches.

07

PRIORITIZE

Evaluate risk, business impact, maturity opportunity, dependency, and effort.

08

ROADMAP

Define the sequenced path forward.

Scaling for complex operations​

For complex operations, DSI scales the practitioner team and runs assessment workstreams in parallel rather than unnecessarily extending the assessment. Onsite disruption stays contained, and evidence collection remains complete across every dimension in scope.​

TIMELINE BASELINE

1 Week

Typical Onsite Assessment​

Up to 2 weeks flex for larger or more complexoperations

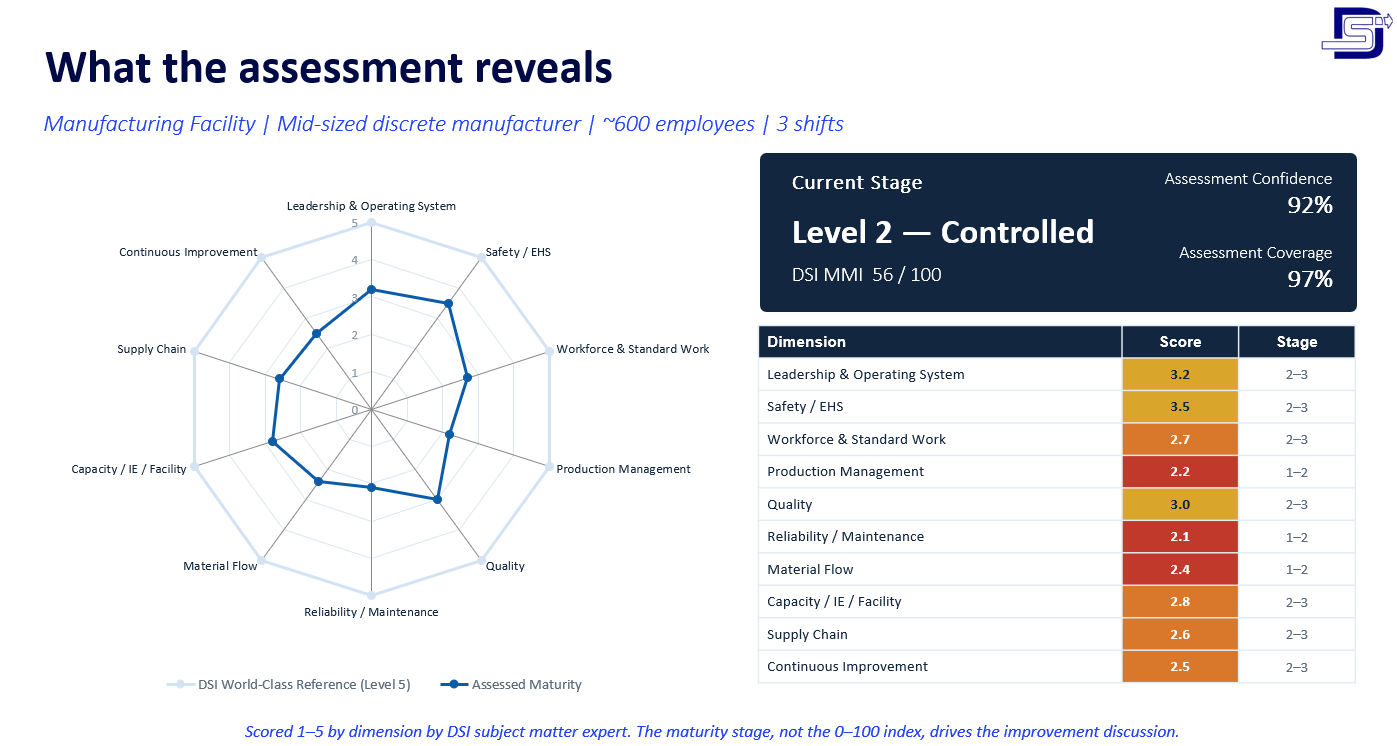
CURRENT STAGE: LEVEL 2 — CONTROLLED

DSI MMI: 56 / 100

Dimension
Score
Stage
Leadership & Operating System
3.2
2–3
Safety / EHS
3.5
2–3
Workforce & Standard Work
2.7
2–3
Production Management
2.2
1–2
Quality
3.0
2–3
Reliability / Maintenance
2.1
1–2
Material Flow
2.4
1–2
Capacity / IE /Facility
2.8
2–3
Supply Chain
2.6
2–3
Continuous Improvement
2.5
2–3

ASSESSMENT RESULTS

What the assessment reveals

Manufacturing Facility | Mid-sized discrete manufacturer | ~600 employees | 3 shifts

Scored 1–5 by dimension by DSI subject matter expert. The maturity stage, not the 0–100 index, drives the improvement discussion.

PRODUCTION PLANNING & SCHEDULING

A score is only useful if you understand why.

What DSI Observed

Formal production schedules are in place.

Shortages and expedite requests often force priorities to shift.

Capacity assumptions aren't always validated against actual performance.

Schedule performance isn't reviewed consistently.

Supervisors rely on their own methods to manage local priorities.

Potential Improvement Approaches

Capacity validation

Planning-process redesign

Constraint integration

Finite-capacity scheduling

ERP / MES enablement where justified

02

Why DSI Assigned Level 2

Current

Basic production controls are in place, but consistent execution still depends on supervisors stepping in. The process is not yet standardized or repeatable enough to meet Level 3.

03

Next-Level Requirement — Level 3

Define realistic capacity assumptions, establish clear rules for schedule changes, routinely measure schedule attainment, and manage exceptions through a consistent process.

05

Level 5 — DSI World-Class Reference

Scheduling is fully integrated and accounts for real constraints across capacity, labor, materials, equipment availability, and production performance. Advanced scenario planning and optimization support faster, better-informed decisions.

DSI does not simply provide a score. We explain what we observed, why it matters, and what greater maturity looks like.

SOLUTION PATH

Evidence to a credible solution path.

01

EVIDENCE

Parts frequently arrive late to point of use.

02

FINDING

Material presentation and replenishment are inconsistent.

03

ROOT CAUSE

Material routes and replenishment rules are not standardized.

04

BUSINESS IMPACT

Excess travel, WIP, congestion, and schedule disruption.

05

MATURITY

Material Flow maturity is below the standardized state.

06

MISSING CAPABILITY

Defined material routes, replenishment logic, and point-of-use standards.

07

POTENTIAL SOLUTIONS

Material-flow redesign, supermarket strategy, route optimization, and pull-system improvements.

08

POTENTIAL DSI CAPABILITIES

Material flow engineering, facility layout, simulation, and implementation support.

Not every maturity gap becomes a project. DSI establishes the opportunity and the credible solution paths; management determines where investment makes sense.

IMPLEMENTATION

From assessment to implementation.

Design Systems combines independent operational assessment with the manufacturing and engineering depth required to move from diagnosis to implementation.

01 · OPERATIONAL FACTS

02 ·MANUFACTURING MATURITY

03 ·CAPABILITY GAPS

04 ·POTENTIAL SOLUTIONS

05 ·PRIORITIZED ROADMAP

06 ·ENGINEERED IMPLEMENTATION

SELECTED DOWNSTREAM DSI CAPABILITIES

Industrial Engineering

Manufacturing Engineering

Material Flow

Facility Planning

Quality Engineering

Reliability / Maintenance

Simulation

Automation / Robotics

Controls

Digital Manufacturing

Supply Chain

Program Management

Frequently Asked Questions